Are regional conferences better for the environment?
 Travel network for a regional conference format
‘Change life!’ ‘Change society!’ These precepts mean nothing without the production of an appropriate space. . . new social relationships call for a new space, and vice versa.
— Henri Lefebvre, The Production of Space
The Story
The COVID-19 pandemic has radically changed the way humans move through space and this change foreshadows the dramatic behavioral and structural shifts climate change demands from humankind.1 Greenhouse gas (GHG) emissions associated with work commutes and industry/professional travel have substantially decreased, leading to distinct improvements in air and water quality.2 The International Energy Agency reports global CO2 emissions dropped 6% compared to 2019, the largest reduction ever at almost 2 gigatons.3
In the wake of lockdowns and event cancellations clearer skies and lack of traffic made the benefits of reduced travel real. It has given us an opportunity to reevaluate the importance of shared spaces and the ways we navigate to and embody them. This transformation formed the impetus for research recently published by myself and a team of Psychiatrists at the Group for the Advancement of Psychiatry (GAP).
We estimated the carbon footprint associated with the 2018 and 2019 Annual Meetings of the largest psychiatric association in the world, the American Psychiatric Association (APA), then measured how this carbon footprint changes if meetings are held in different locations.4 We wanted to understand the environmental costs of holding these meetings and what could be done to mitigate them. If you are interested about the research this case study builds upon, you can check out Wortzel et al. (2021) with no paywall here.
The carbon footprint of such conferences has been shown to be substantial. Wortzel et al. (2021) estimate the 2018 and 2019 APA Annual Meetings produced about 20,000 metric tons of carbon-dioxide equivalent (CO2e) emissions each—an amount equal to burning 22 million pounds of coal.5 This carbon footprint is highly dependent on the distance attendees have to travel. For example, holding the Annual Meeting in Hawaii would produce more emissions than holding over 2.5 Annual Meetings in New York City if the same people attended.6 Klöwer et al. (2020) estimate the carbon footprint from the American Geophysical Union’s 2019 fall meeting at 80,000 metric tons of carbon dioxide equivalents (over 4x the APA’s Annual Meeting) and show that this footprint can be mitigated by 80%-90% just from holding regional conferences in well thought-out locations or offering hybrid in-person and virtual meetings. Similar analyses have been done for the European Astronomical Society’s 2019 annual meeting.
This research shows that taking into account the geographic dispersion of the attendance base and choosing a location accordingly can drastically reduce large conferences’ environmental impact while changing little else. In this post I expand upon Wortzel et al. (2021) by examining another solution to help curb emissions. I test the impact of breaking up one large conference into multiple regional conferences by building a simulation using data from past APA meetings.
History of the Carbon Footprint
Though I use the term carbon footprint throughout this post, I want to acknowledge the (not so pretty) history behind the term. The phrase grew out of a related concept—the ecological footprint—invented in the 90s by ecologist William Rees and regional planner Mathis Wackernagel.7
However it was not until the early 2000s that the term was popularized by oil giant BP. In 2004, BP unveiled the first “carbon footprint calculator” which provided individuals with a way to quantify how much heat-trapping carbon pollution they were releasing into the atmosphere.8 Unfortunately, it provided users with no way of measuring the carbon footprint of drilling deep into the Earth to extract fossil fuels and occasionally dumping thousands of gallons of it into the ocean.

Shifting the discourse of pollution onto the individual has long been a tactic of the largest corporate polluters. Research on global warming must acknowledge and push back against this narrative.
A Regional Format for the APA
The APA has 7 distinct regions between the US and Canada.9 I use this existing framework to simulate the regional conferences.
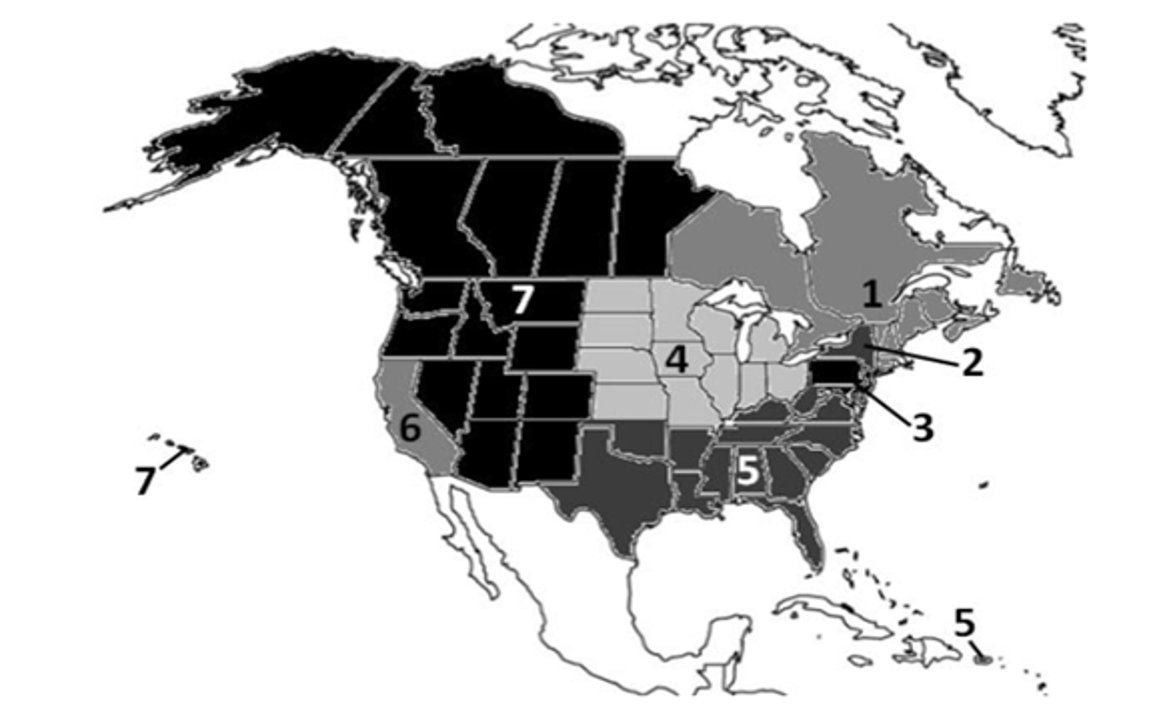
- New England & Eastern Canada [⬤]
- New York [⬤]
- Middle Atlantic [⬤]
- North Central [⬤]
- American South & Puerto Rico [⬤]
- California [⬤]
- American West & Western Canada [⬤]
Though the APA has a considerable amount of international members, only Canadians are given a regional designation.
Simulation Framework
Using attendance data from the APA’s 2018 New York City and 2019 San Francisco Annual Meetings, I assign each attendee to one of these seven regions based on their origin location and then identify likely transport modes and routes according the assumptions laid out in Wortzel et al. (2021).
The simulation classifies attendees into either drivers or fliers based on their distance from the meeting location.10 Attendees less than 400 km (under 4 hr. driving) are assumed to drive directly to the meeting. All other attendees drive to the closest commercial airport and then fly direct to the nearest commercial airport to the meeting. I then apply an emissions function to the ground and air legs of each attendee’s round-trip route.11
In order to simulate the way attendees would travel to the regional conferences, I had to extend some assumptions from Wortzel et al. (2021). I assume international attendees not part of the existing regional structure travel to whichever meeting is closest, ensuring a conservative estimate. The other extending assumption is the location of the seven regional meetings. I select locations where the APA has previously held Annual Meetings, except for Seattle.12
Visualizing Travel
To understand the effect of the regional categorization, we can compare the travel paths between the Annual Meeting and regional meeting simulations. The map below shows everyone who attended the 2018 Annual Meeting in New York City, over 16 thousand people.13
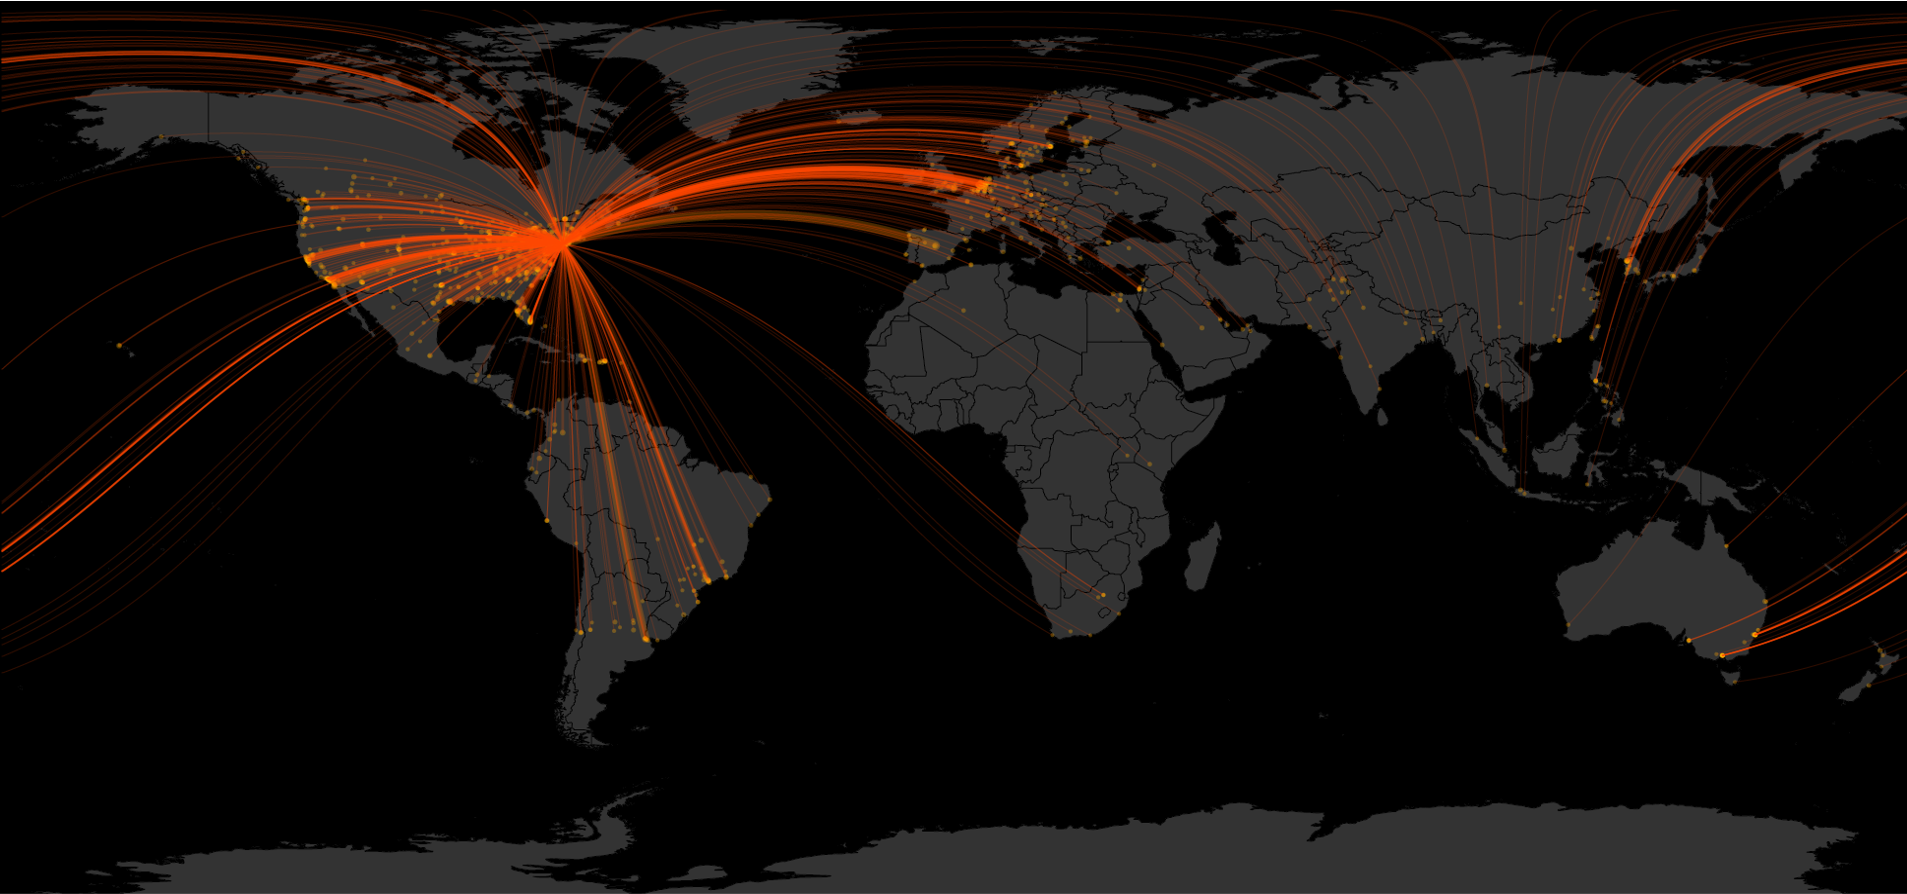
Here we can see all attendees converge on the Javits Center in New York City.
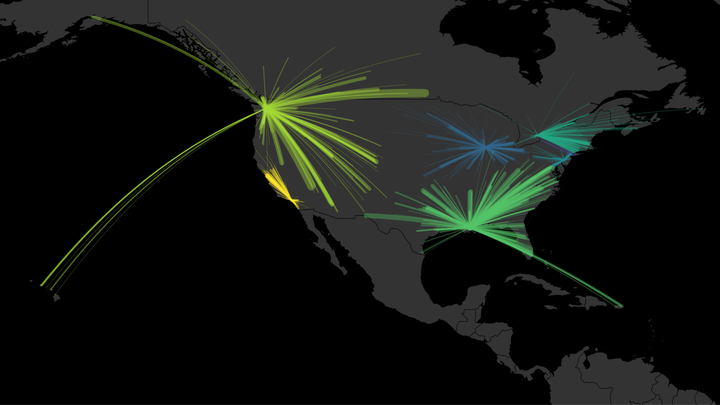
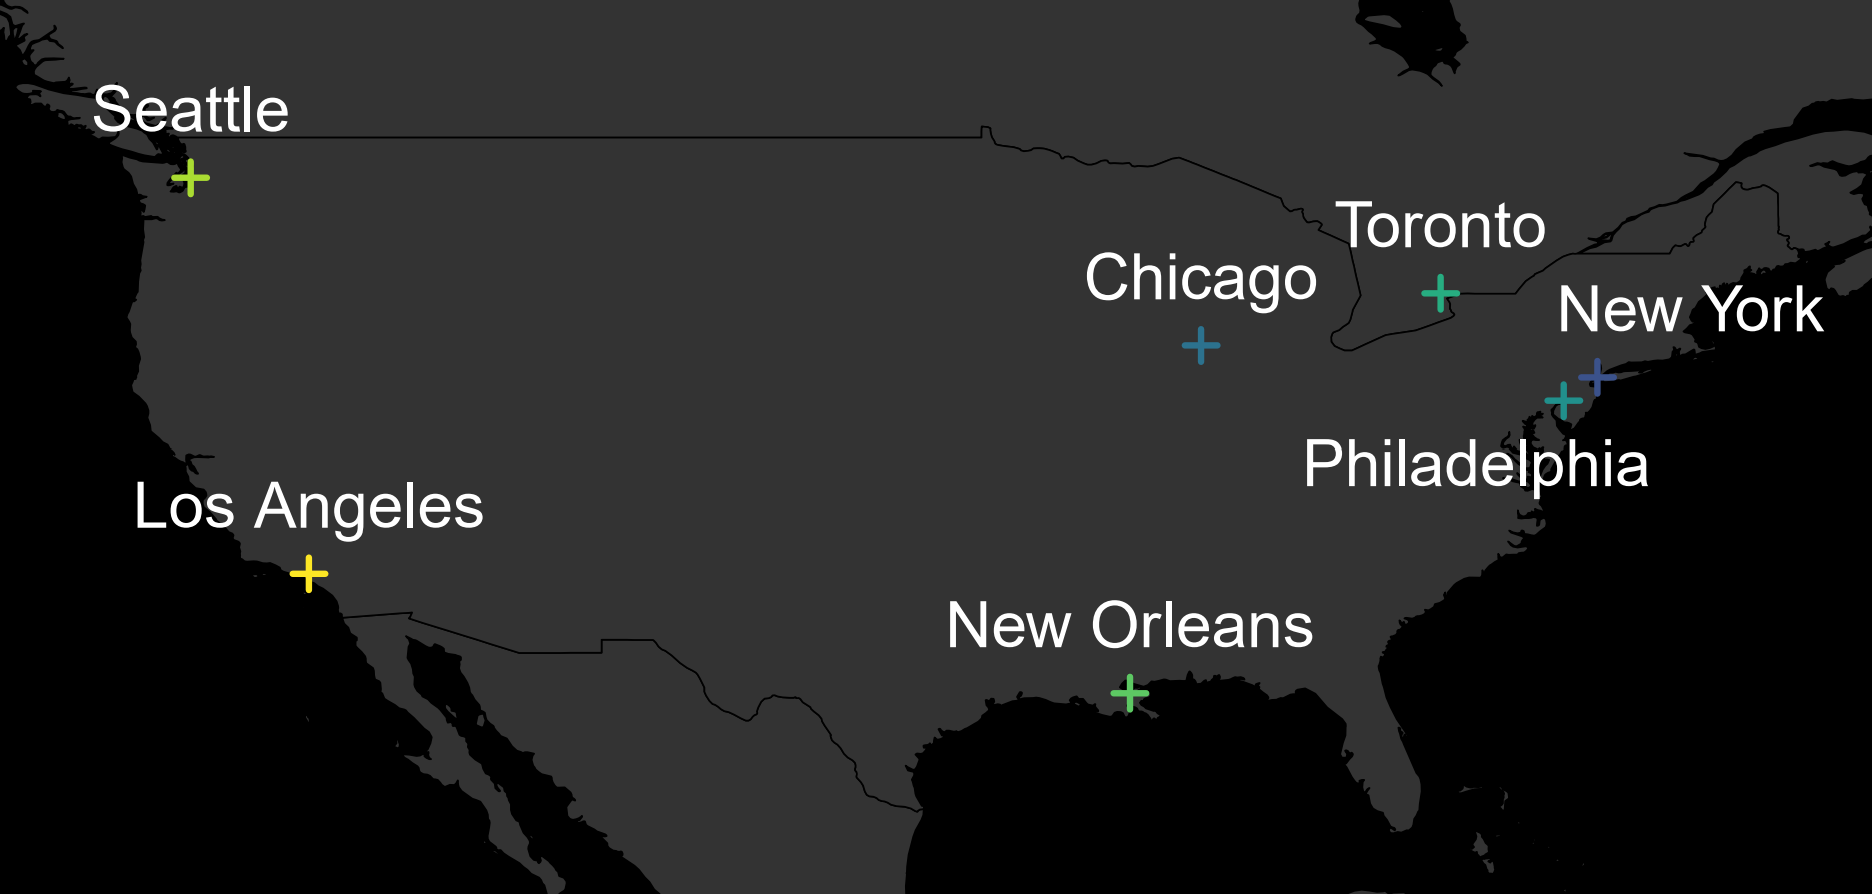
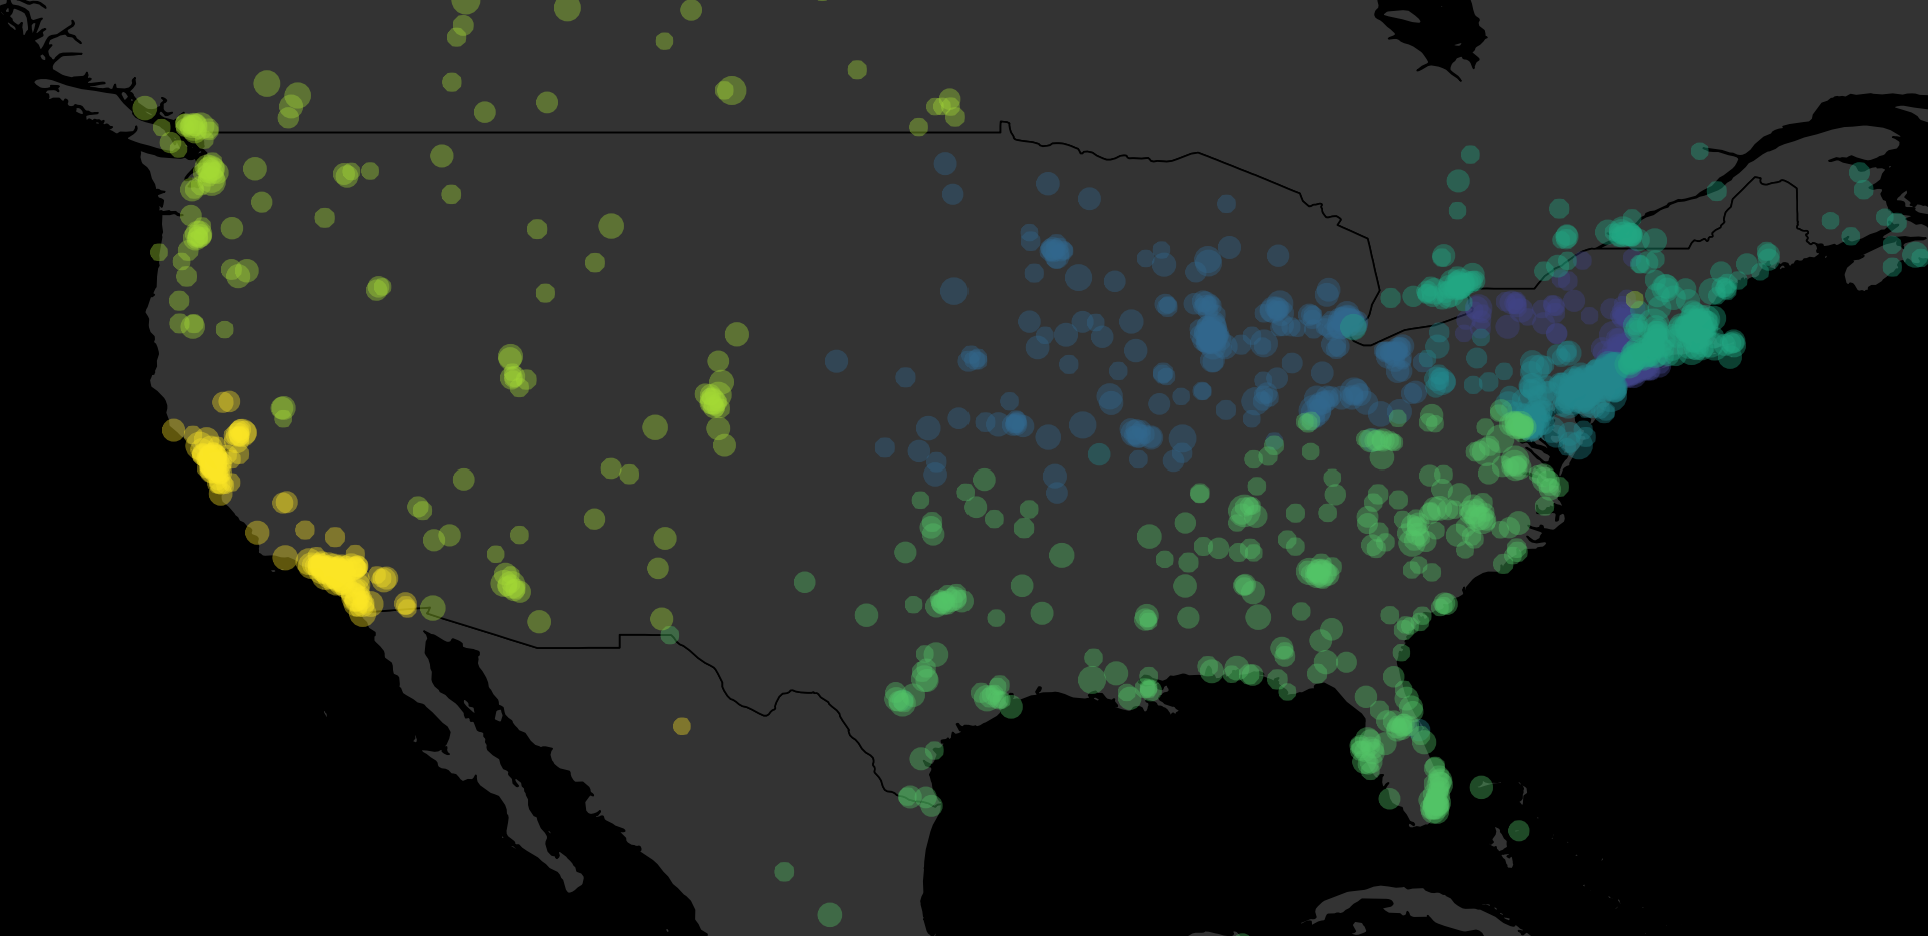
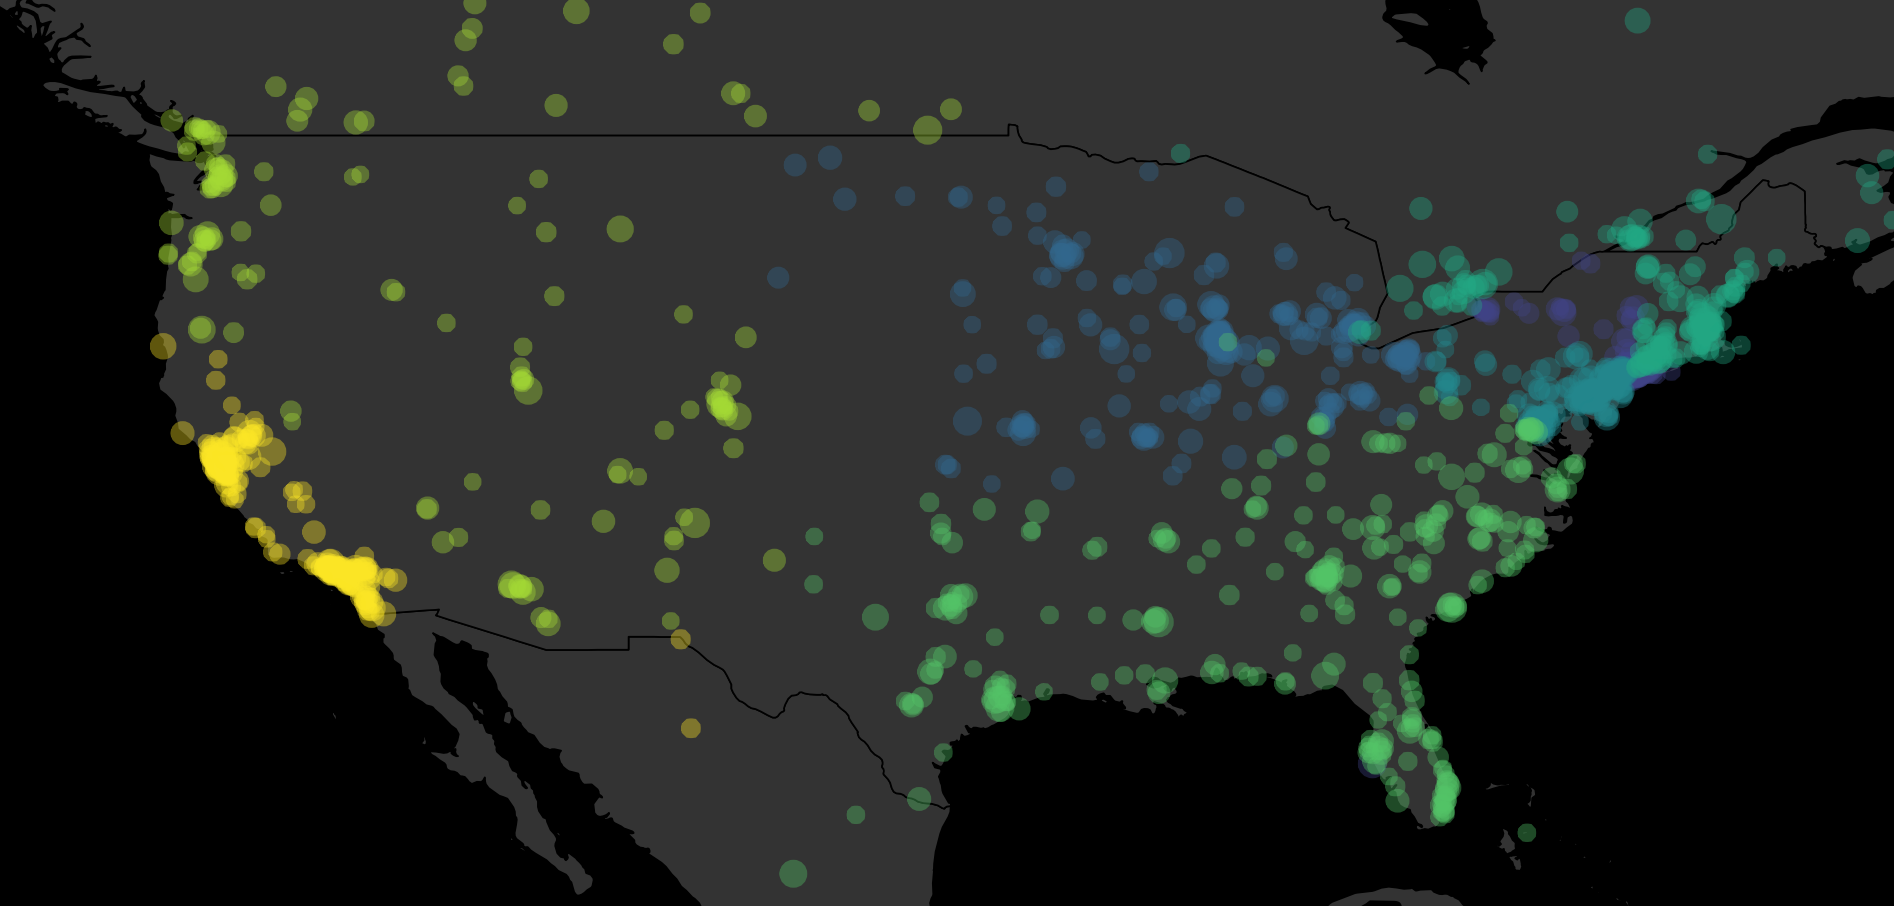
Now, let’s examine the map when attendees from the 2018 NYC meeting travel to the regional meetings instead.
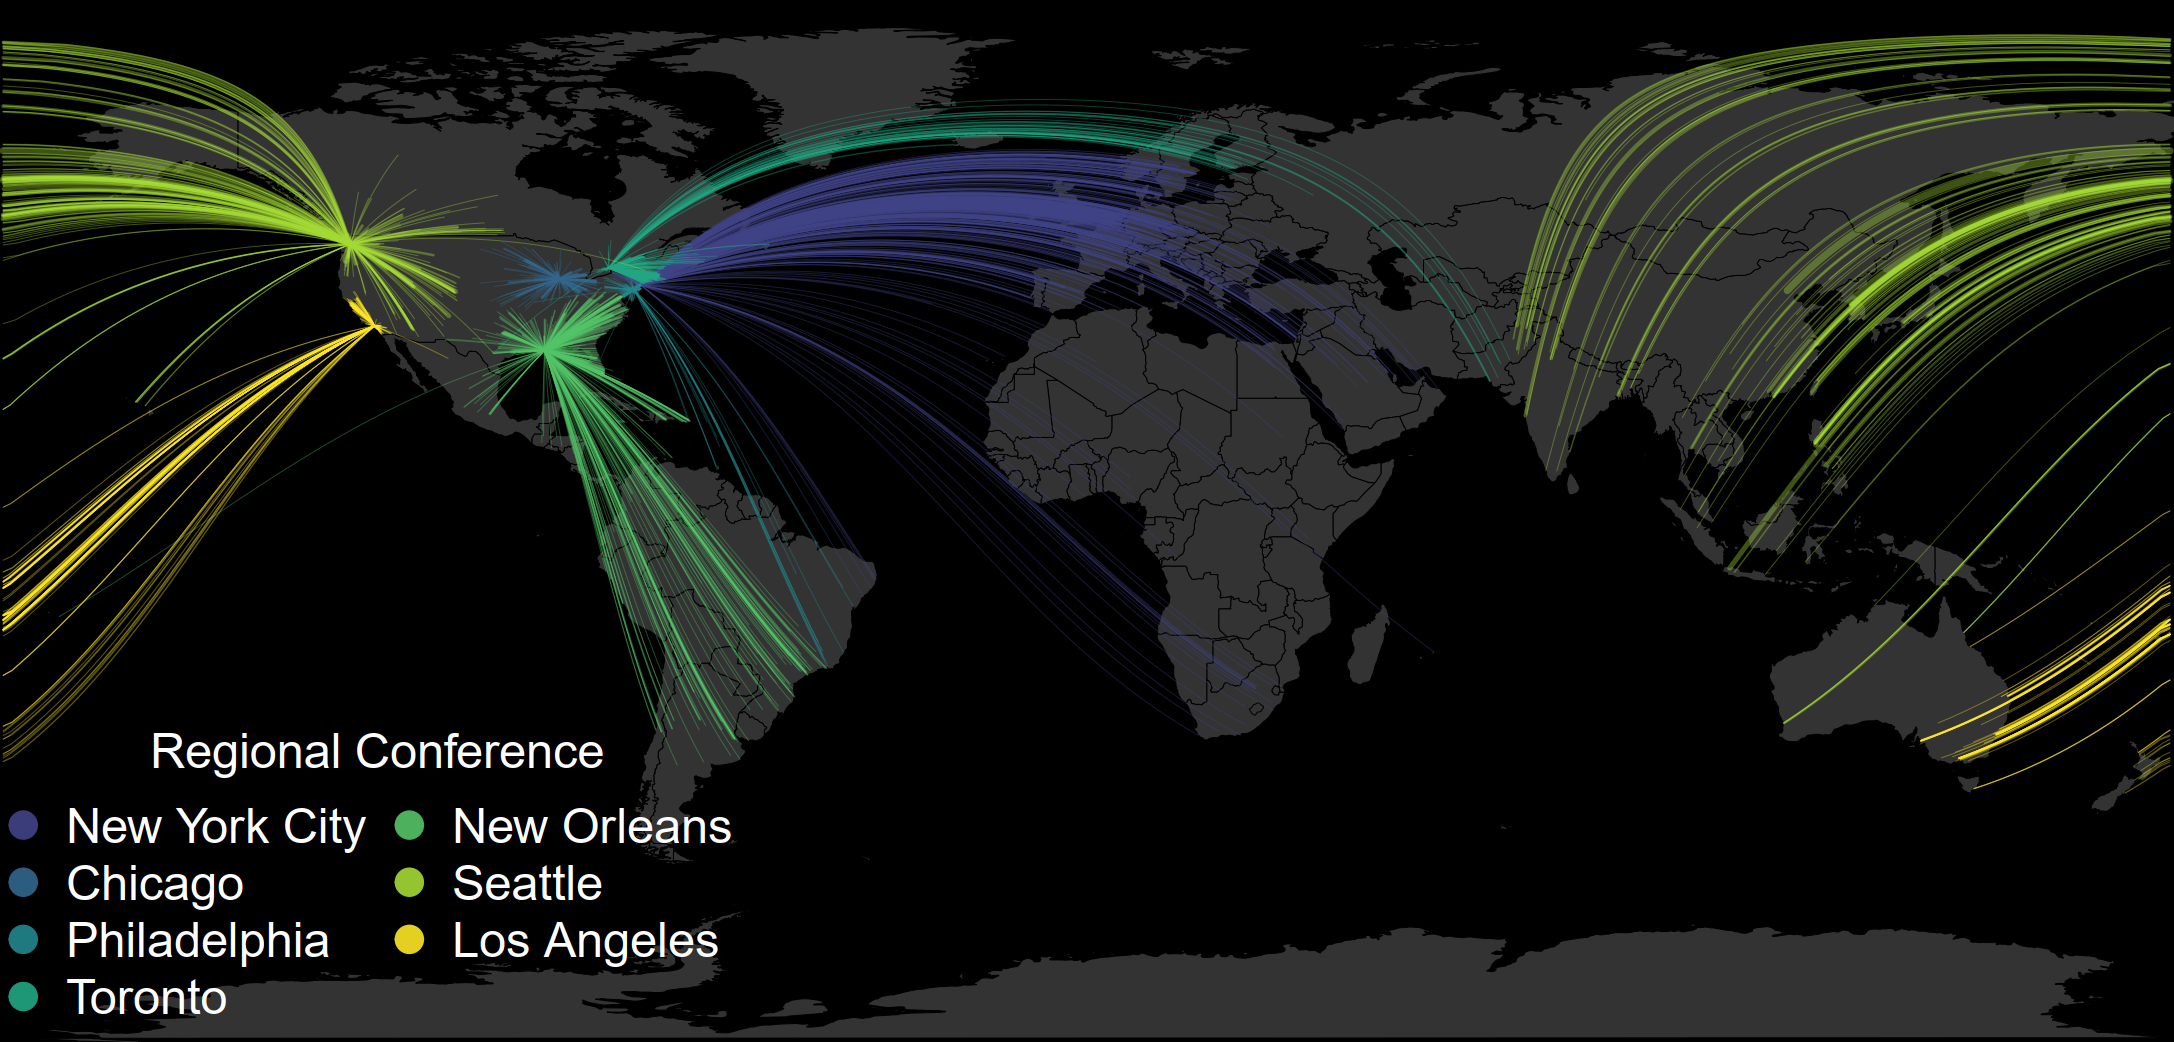
Most of the European attendees are absorbed by Region 3 (purple, New York City conference). Most of the Asian attendees are absorbed by Region 7 (lime green, Seattle conference), and most of the Australian attendees are absorbed by Region 6 (yellow, Los Angeles conference).
Attendance is somewhat evenly distributed across regions . . .

The attendance at each regional meeting is around 1,500 to 3,000. This is a good indication that the regional designations assigned by the APA and our assumptions about international attendees break the membership base into somewhat even parts. The exception is the New York City meeting on the left panel because it captures the majority of international attendees, whom are largely from Europe (see regional map above). When we use the 2019 Data the attendance is much more even.
Regional Simulation Resuts
Following our assumptions, I estimate total GHG emissions for the meetings under the regional conference format. The tables below present the results for the 2018 New York City and 2019 San Francisco simulations.
| Measure | Attendance | Total Emissions | Emissions per Person |
|---|---|---|---|
| Actual Meeting1 | 16,620 | 19,819 | 1.19 |
| Regional Meetings2 | 16,620 | 15,050 | 0.91 |
| Difference | — | 4,769 | 0.28 |
| Percent Difference | — | 24% | 24% |
| Notes and Sources: | |||
| Code for this analysis can be found at: https://github.com/Alec-Stashevsky/GAP-climate-research. | |||
| 1 Data are from Wortzel et al. (2021). | |||
| 2 Results from this supplemental regional analysis. |
| Measure | Attendance | Total Emissions | Emissions per Person |
|---|---|---|---|
| Actual Meeting1 | 13,335 | 21,456 | 1.61 |
| Regional Meetings2 | 13,335 | 10,189 | 0.76 |
| Difference | — | 11,267 | 0.53 |
| Percent Difference | — | 53% | 53% |
| Notes and Sources: | |||
| Code for this analysis can be found at: https://github.com/Alec-Stashevsky/GAP-climate-research. | |||
| 1 Data are from Wortzel et al. (2021). | |||
| 2 Results from this supplemental regional analysis. |
The total emissions are significantly lower under the regional conference format. Compared to the original meeting at the Javits Center in NYC, a regional conference format would save almost 5 thousand metric tons of carbon dioxide equivalents—a 24% reduction. The regional format for the SF meeting reduced the emissions by more than half!14
Why do the SF regional meetings save so much more emissions than the NYC meetings? One reason is because people had to travel farther on average to attend the SF Annual Meeting which made it less efficient than the NYC meeting. Though over 3,300 fewer people attended the SF meeting, almost 2,000 more tons of CO2e was produced.15
NYC Attendance is concentrated in the Eastern US . . .
| Region | Attendees | Percent |
|---|---|---|
| Northeast | 6,298 | 55.5% |
| West | 1,597 | 14.1% |
| Southeast | 1,562 | 13.8% |
| Midwest | 1,360 | 12.0% |
| Southwest | 534 | 4.7% |
| Notes and Sources: | ||
| - Data are from Wortzel et al. (2021). |
But less so for the SF Meeting . . .
| Region | Attendees | Percent |
|---|---|---|
| Northeast | 3,603 | 36.4% |
| West | 3,072 | 31.0% |
| Southeast | 1,355 | 13.7% |
| Midwest | 1,317 | 13.3% |
| Southwest | 552 | 5.6% |
| Notes and Sources: | ||
| - Data are from Wortzel et al. (2021). |
The majority of the APA membership base who attended the 2018 and 2019 Annual Meetings are from the East Coast, so it makes sense that the meetings closest to this region will reduce emissions. However, we know nothing about what that attendance could look like in an alternate universe where the APA Meeting was held under the beautiful Grand Tetons in, say, Jackson Hole, Wyoming. Holding meetings in new locations is useful to test how other sections of the membership can be motivated to attend if the meetings are closer to them.

The Benefits of Regional Conferences
Based on this simulation study regional conferences can reduce a meeting’s carbon footprint by over 50% (given a similar attendance), but there are many more aspects that make regional conferences an attractive solution—especially if they are held as supplements to centralized conferences.
Regional conferences are much smaller and usually break up a community into geographically-connected regions. This smaller format may be easier to administer, less costly, and provide attendees with more intimate opportunities to network with local colleagues. Smaller meetings may increase engagement in working groups or activities limited by size or participation.
Regional conferences allow for discourse built-up from a more concentrated membership. This may be particularly beneficial for associations advancing policy because such a format allows regions to develop a set of priorities most relevant to them (such as focusing on state or municipal policy) and then advance this smaller set of priorities to the larger base whose scale may in turn provide much needed support.
Regional conferences may also have the potential to increase attendance and subsequently revenue. Some members may find it too expensive or too time consuming to travel long distances to centrally-located conferences. This may alienate sections of the membership in fringe geographies and discourage others who feel not enough of their colleagues will attend.
Traveling to remote conference destinations can be attractive for those who wish this time to double as a vacation, but it may leave the conference vulnerable to drops in attendance as some locations are more favorable than others.16 More importantly, such a framework may introduce priorities contradictory to emissions reduction. Meeting planners may be pressured to hold meetings in more remote places to encourage attendance and significantly increase emissions from travel as a result.
⸙⸙⸙
Conference administrators and planners can unlock a powerful framework to mitigate GHG emissions by simply understanding where their attendees come from. Choosing locations which reduce the distance attendees have to travel can cut emissions over 3-fold while changing little else. Regional format conferences are another tool administrators and planners have in their kit to mitigate against emissions and potentially augment attendance.
As of 2017, almost 35 million square meters of indoor space was dedicated to some form of exhibition.17 When we consider the impact of such environmentally-conscious planning on an industry-level, the potential reduction in emissions is huge.
I would like to thank my coauthors from GAP, especially Dr. Joshua Wortzel and Dr. Elizabeth Haase for the opportunity to support this research.
If you are interested in performing similar analyses for your conference please checkout the Code Repository on my GitHub, or feel free to reach out!
References
This radical anthropause has no doubt effected wildlife as well. See Rutz et al. (2020).↩︎
Yunus, Masago, and Hijioka (2020) and Venter et al. (2020).↩︎
We measured the effect of moving both the 2018 and 2019 meetings by shifting the original location of each meeting to 13 different locations that the APA has used over the past 40+ years. In addition to measuring the carbon footprint from these 13 alternate locations, we employed a minimization procedure which identified a narrow region on the Earth that would globally minimize the carbon footprint using attendance data for each Annual Meeting. See Wortzel et al. (2021).↩︎
Carbon-dioxide equivalents is a measure used to combine the impact of various greenhouse gasses to global warming under a common unit. It converts greenhouse gasses to the amount of carbon-dioxide it would take to have an equivalent impact to global warming.↩︎
Such an assessment assumes that the exact same people will show up to a meeting in Hawaii and a meeting in New York City and this is probably not true. Nonetheless, the analysis still provides us with a gauge for the impact of meeting location. See Table in Wortzel et al. (2021) for the full assessment of meeting locations.↩︎
Selin, N. Eckley. Carbon footprint. Encyclopedia Britannica. Available at: https://www.britannica.com/science/carbon-footprint.↩︎
Including US protectorates.↩︎
Geodesic distance is used to measure the path between the meeting and the attendee’s origin. This is the shortest path between two points on the globe (accounting for Earth’s ellipsoidal nature).↩︎
The driving distance is measured as the geodesic distance between locations and therefore underestimates the total driving distance. We use the EPA guidelines to estimate the emissions from passenger vehicles and GoClimate’s flight emissions API to estimate emissions from air travel. The flight emissions API performs a number of additional methods to correct for flight detours (flights often take a longer route then the geodesic distance), number of passengers, cabin class, and variable short-distance and long-distance fuel consumption. The GoClimate API uses a radiative forcing index of 2, which is a conservative estimate.↩︎
This is because no APA Annual Meetings have been held in region 7.↩︎
Each light orange point represents a unique origin where the size and opacity of the points is proportional to the number of attendees traveling from that location. The darker-orange arcs indicate the geodesic distance or distance as the crow flies between each origin point and the location of the 2018 New York City meeting. Geodesic distance is the shortest path between two points on the globe. Commercial flight paths are usually longer then the geodesic distance between two points. Our flight emissions model corrects for this difference.↩︎
I performed an additional analysis to test how sensitive our estimates were to the location of the regional meetings by allowing all attendees to travel to the closest meeting, regardless of their designated region. The results from this analysis show a 5% and 8% greater reduction in emissions compared to the regional format scenario for the NYC and SF meetings, respectively. Overall, the larger the number of regional meetings, the less impact individual location choice will have.↩︎
We can also see this by examining the per capita carbon footprint. San Francisco attendees produced over 400 kg (0.4 metric tons) more CO2e on average compared to attendees of the New York meeting.↩︎
For example, medical associations host a disproportionately small amount of conferences in Las Vegas. I have a few reasons why that might be. . .↩︎
Exhibition space is defined as the amount of gross space in the venue regularly marketed and rented/licensed/used for exhibitions, trade fairs or consumer/public shows. This space is measured for any public assembly premises with a minimum of 5,000 square meters of indoor exhibition space and that hold various types of exhibitions, trade fairs or consumer/public shows on a regular basis. The premises may be purpose-built exhibition center space or other premises including exhibition space (e.g. hotels, arenas, sport venues, and amusement fair grounds). See UFI World Map Of Exhibition Venues (2017 Edition, Revised December 2018).↩︎